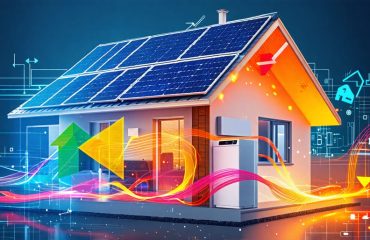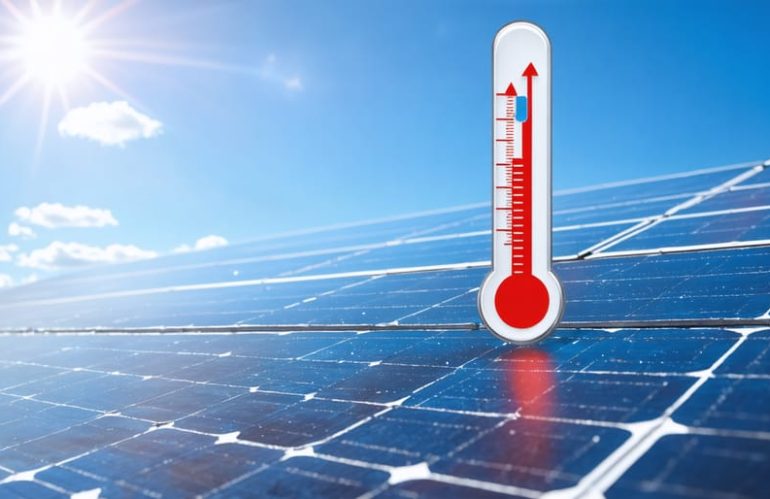
Temperature plays a pivotal role in your solar panel’s performance, directly impacting your energy savings and return on investment. While solar panels harness sunlight efficiently, their power output typically decreases by 0.3% to 0.5% for every degree Celsius increase above optimal operating temperatures (25°C/77°F). Understanding this temperature-efficiency relationship helps homeowners make informed decisions about panel placement, maintenance, and performance expectations throughout the year.
A solar panel temperature efficiency chart reveals crucial insights: peak performance occurs during cool, sunny days, while extreme heat can reduce output by up to 25%. This knowledge empowers homeowners to optimize their solar installation through strategic panel positioning, proper ventilation, and regular maintenance. Whether you’re considering solar installation or looking to maximize your existing system’s efficiency, grasping the temperature-performance correlation ensures you get the most from your renewable energy investment.
Recent innovations in panel design and temperature management systems have made modern solar installations more resilient to temperature fluctuations, but understanding these efficiency patterns remains essential for smart solar ownership.
Understanding Solar Panel Temperature Effects
The Temperature Coefficient
The temperature coefficient is a crucial factor that influences solar panel efficiency ratings and overall performance. Simply put, it measures how much a panel’s power output changes when temperatures rise above or fall below the standard testing temperature of 25°C (77°F).
Most solar panels have a negative temperature coefficient, typically ranging from -0.2% to -0.5% per degree Celsius. This means that for every degree the temperature increases above 25°C, the panel’s power output decreases by that percentage. For example, if your panel has a temperature coefficient of -0.4% and operates at 35°C (10 degrees above standard), it will produce 4% less power than its rated capacity.
This relationship between temperature and efficiency explains why solar panels actually perform better on clear, cool days than on extremely hot summer afternoons. Despite receiving intense sunlight, high temperatures can significantly reduce their effectiveness. Understanding your panels’ temperature coefficient helps set realistic expectations for seasonal performance and can guide installation decisions, such as ensuring proper ventilation behind the panels.
Modern solar technologies are continuously improving, with some manufacturers developing panels with better temperature coefficients, helping maintain higher efficiency even in warm conditions. When selecting solar panels for your home, considering the temperature coefficient alongside other factors can help you choose the most suitable option for your climate.
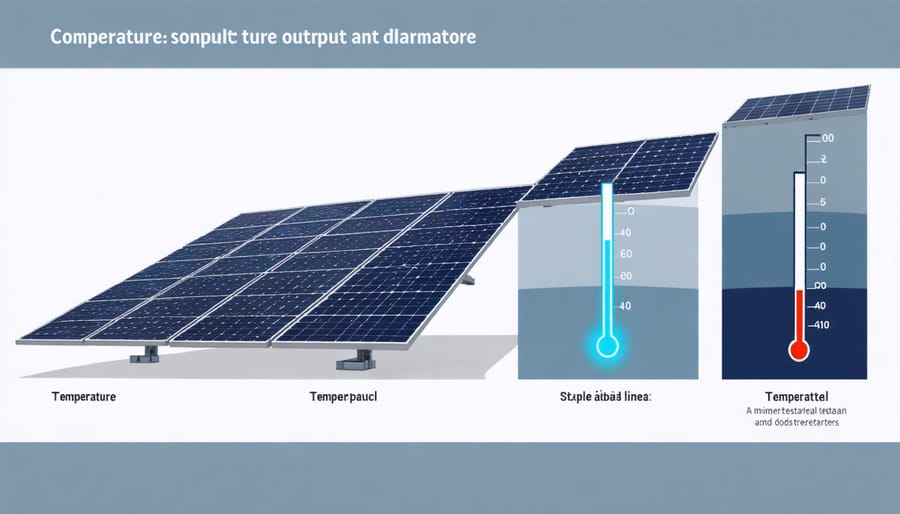
Ideal Operating Temperatures
Solar panels perform best within a specific temperature range, typically between 59°F and 95°F (15°C to 35°C). Contrary to what many might assume, warmer isn’t always better when it comes to solar panel efficiency. In fact, solar panels are more efficient in cooler temperatures, as long as they receive adequate sunlight.
The ideal sweet spot for most residential solar installations is around 77°F (25°C), which manufacturers use as the standard test condition temperature. At this temperature, panels can operate at their rated efficiency levels, typically converting 15-20% of sunlight into electricity.
For every degree Celsius above the ideal temperature, solar panel efficiency typically decreases by 0.3-0.5%. This means on a scorching 95°F (35°C) day, your panels might produce about 10-15% less energy than they would under optimal conditions.
Interestingly, panels can still perform well in cold climates as long as they receive sufficient sunlight. Winter days with bright, clear skies and cool temperatures can actually result in excellent energy production. This is why some of the world’s leading solar markets, like Germany, thrive despite not being particularly sunny.
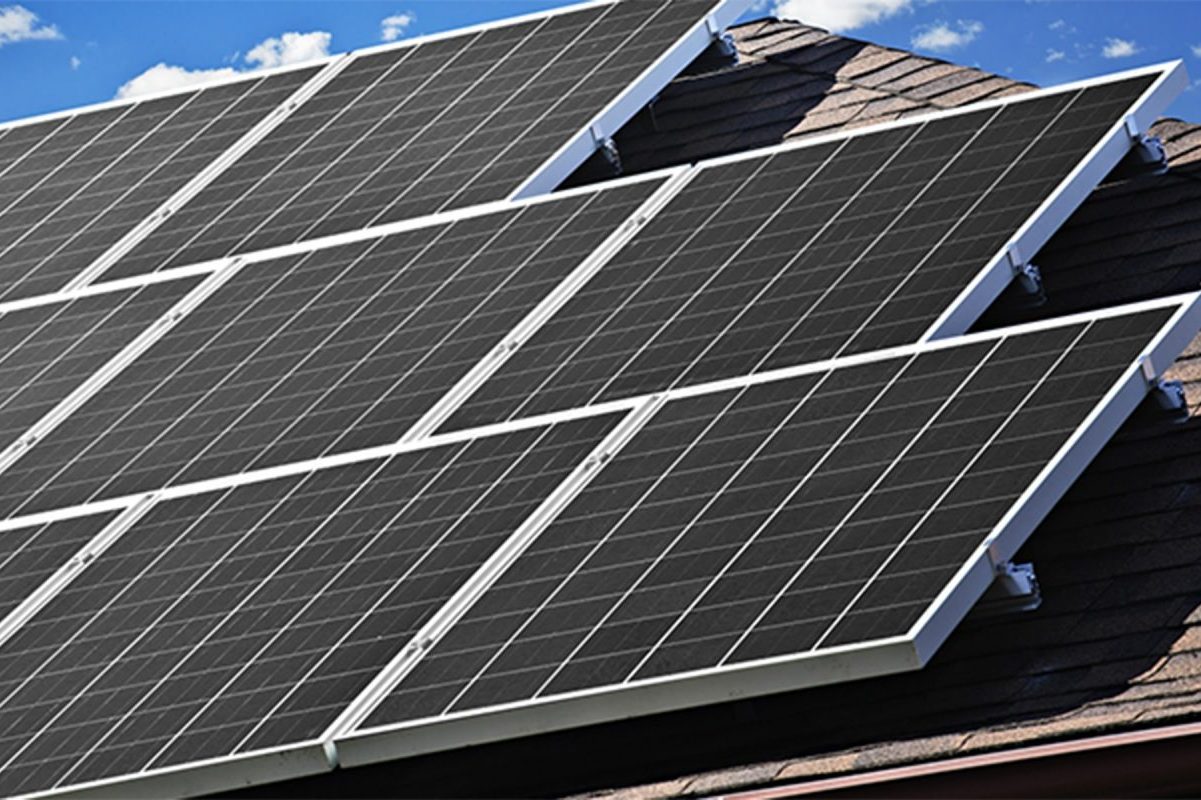
To maintain optimal operating temperatures, proper installation with adequate airflow beneath the panels is crucial. This helps prevent heat buildup and ensures your solar investment performs at its best throughout the year.

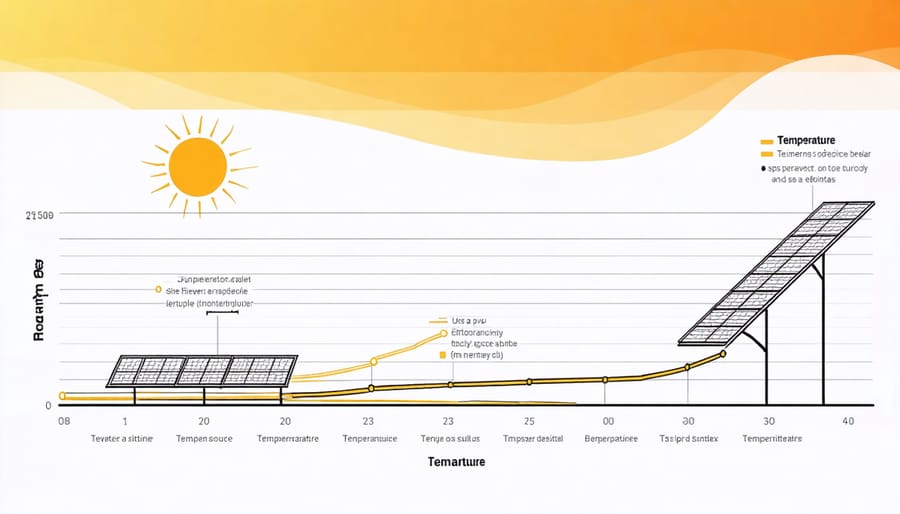
Solar Panel Temperature Performance Chart
Reading the Temperature Efficiency Chart
Reading a temperature efficiency chart is straightforward once you understand its key elements. The vertical axis typically shows efficiency percentage, while the horizontal axis displays temperature in degrees Celsius or Fahrenheit. The chart’s downward slope indicates how solar panel power output decreases as temperature rises.
Most charts show a baseline temperature of 25°C (77°F), which represents standard test conditions. For every degree above this baseline, efficiency typically drops by 0.3% to 0.5%, depending on the panel type. The steeper the line’s decline, the more sensitive the panel is to temperature changes.
To use the chart effectively, locate your area’s average temperatures on the horizontal axis, then track upward to where it intersects with the efficiency line. This intersection point shows you the expected efficiency at that temperature. Some charts include multiple lines representing different panel technologies, making it easy to compare how various models perform under different temperature conditions.
This visual tool helps you make informed decisions about which panels might work best in your specific climate conditions.
Maximizing Performance in Different Weather Conditions
Summer Performance Solutions
While summer brings abundant sunlight, keeping your solar panels operating at peak efficiency requires some proactive steps. To boost your solar panel performance during hot weather, start by ensuring proper ventilation beneath your panels. A gap of 4-6 inches between your roof and panels allows airflow that can reduce operating temperatures by up to 10°F.
Regular cleaning becomes especially important during summer, as dust and debris can trap heat. Schedule monthly cleanings using soft water and a non-abrasive brush during early morning or evening hours. Consider installing micro-inverters or power optimizers, which help maintain efficiency even when some panels experience higher temperatures.
Light-colored roofing materials can reflect heat away from your panels, while strategic shade from tall trees during peak afternoon hours can provide natural cooling without significantly impacting production. Some homeowners also install simple sprinkler systems that can provide occasional cooling mists during extreme heat waves, though this should be discussed with your installer first to ensure compatibility with your system.
Understanding how temperature affects solar panel efficiency is crucial for maximizing your renewable energy investment. As we’ve explored, solar panels generally perform best between 59-95°F (15-35°C), with efficiency dropping as temperatures rise above this range. To maintain optimal performance, consider installing panels with proper ventilation, choosing light-colored mounting systems, and ensuring adequate spacing between panels and your roof. Regular maintenance and monitoring of your system’s output can help you identify temperature-related efficiency issues early. By implementing these practical solutions and understanding your local climate conditions, you can optimize your solar installation’s performance throughout the year. Remember, while high temperatures may slightly reduce efficiency, solar panels still generate significant power even on hot days, making them a reliable and cost-effective energy solution for your home.